The Real Price Of A Footballer
02 September 2026
On deadline day, Manchester City paid Chelsea £125 million for Enzo Fernández, equalling the biggest fee an English club has ever paid, set by Liverpool for Alexander Isak fourteen months earlier. It capped a summer in which the record for a British player had already fallen twice in a week: £116 million from City for Nottingham Forest's Elliot Anderson, then £117 million from Chelsea for Aston Villa's Morgan Rogers. Two records, four moves, and all in the Premier League. At first glance, the numbers say Premier League spending is out of control. Look more closely, and a different picture emerges.
Set the fees against ten years of rising prices, and they look different. In August 2016 Manchester United paid Juventus £89 million for Paul Pogba, a world record at the time. Prices in Britain have risen 42% since, according to the ONS Consumer Prices Index (CPI). That fee in today’s money is £126 million.
So, based on CPI, the record has been matched twice in a year, and this summer’s version is £1 million short of where it stood in real terms a decade ago. Measured by what money actually buys, nothing paid this summer exceeds what United paid in 2016. Across the decade, only Liverpool’s fee for Isak, restated to today’s prices, edges past it by about £3 million.
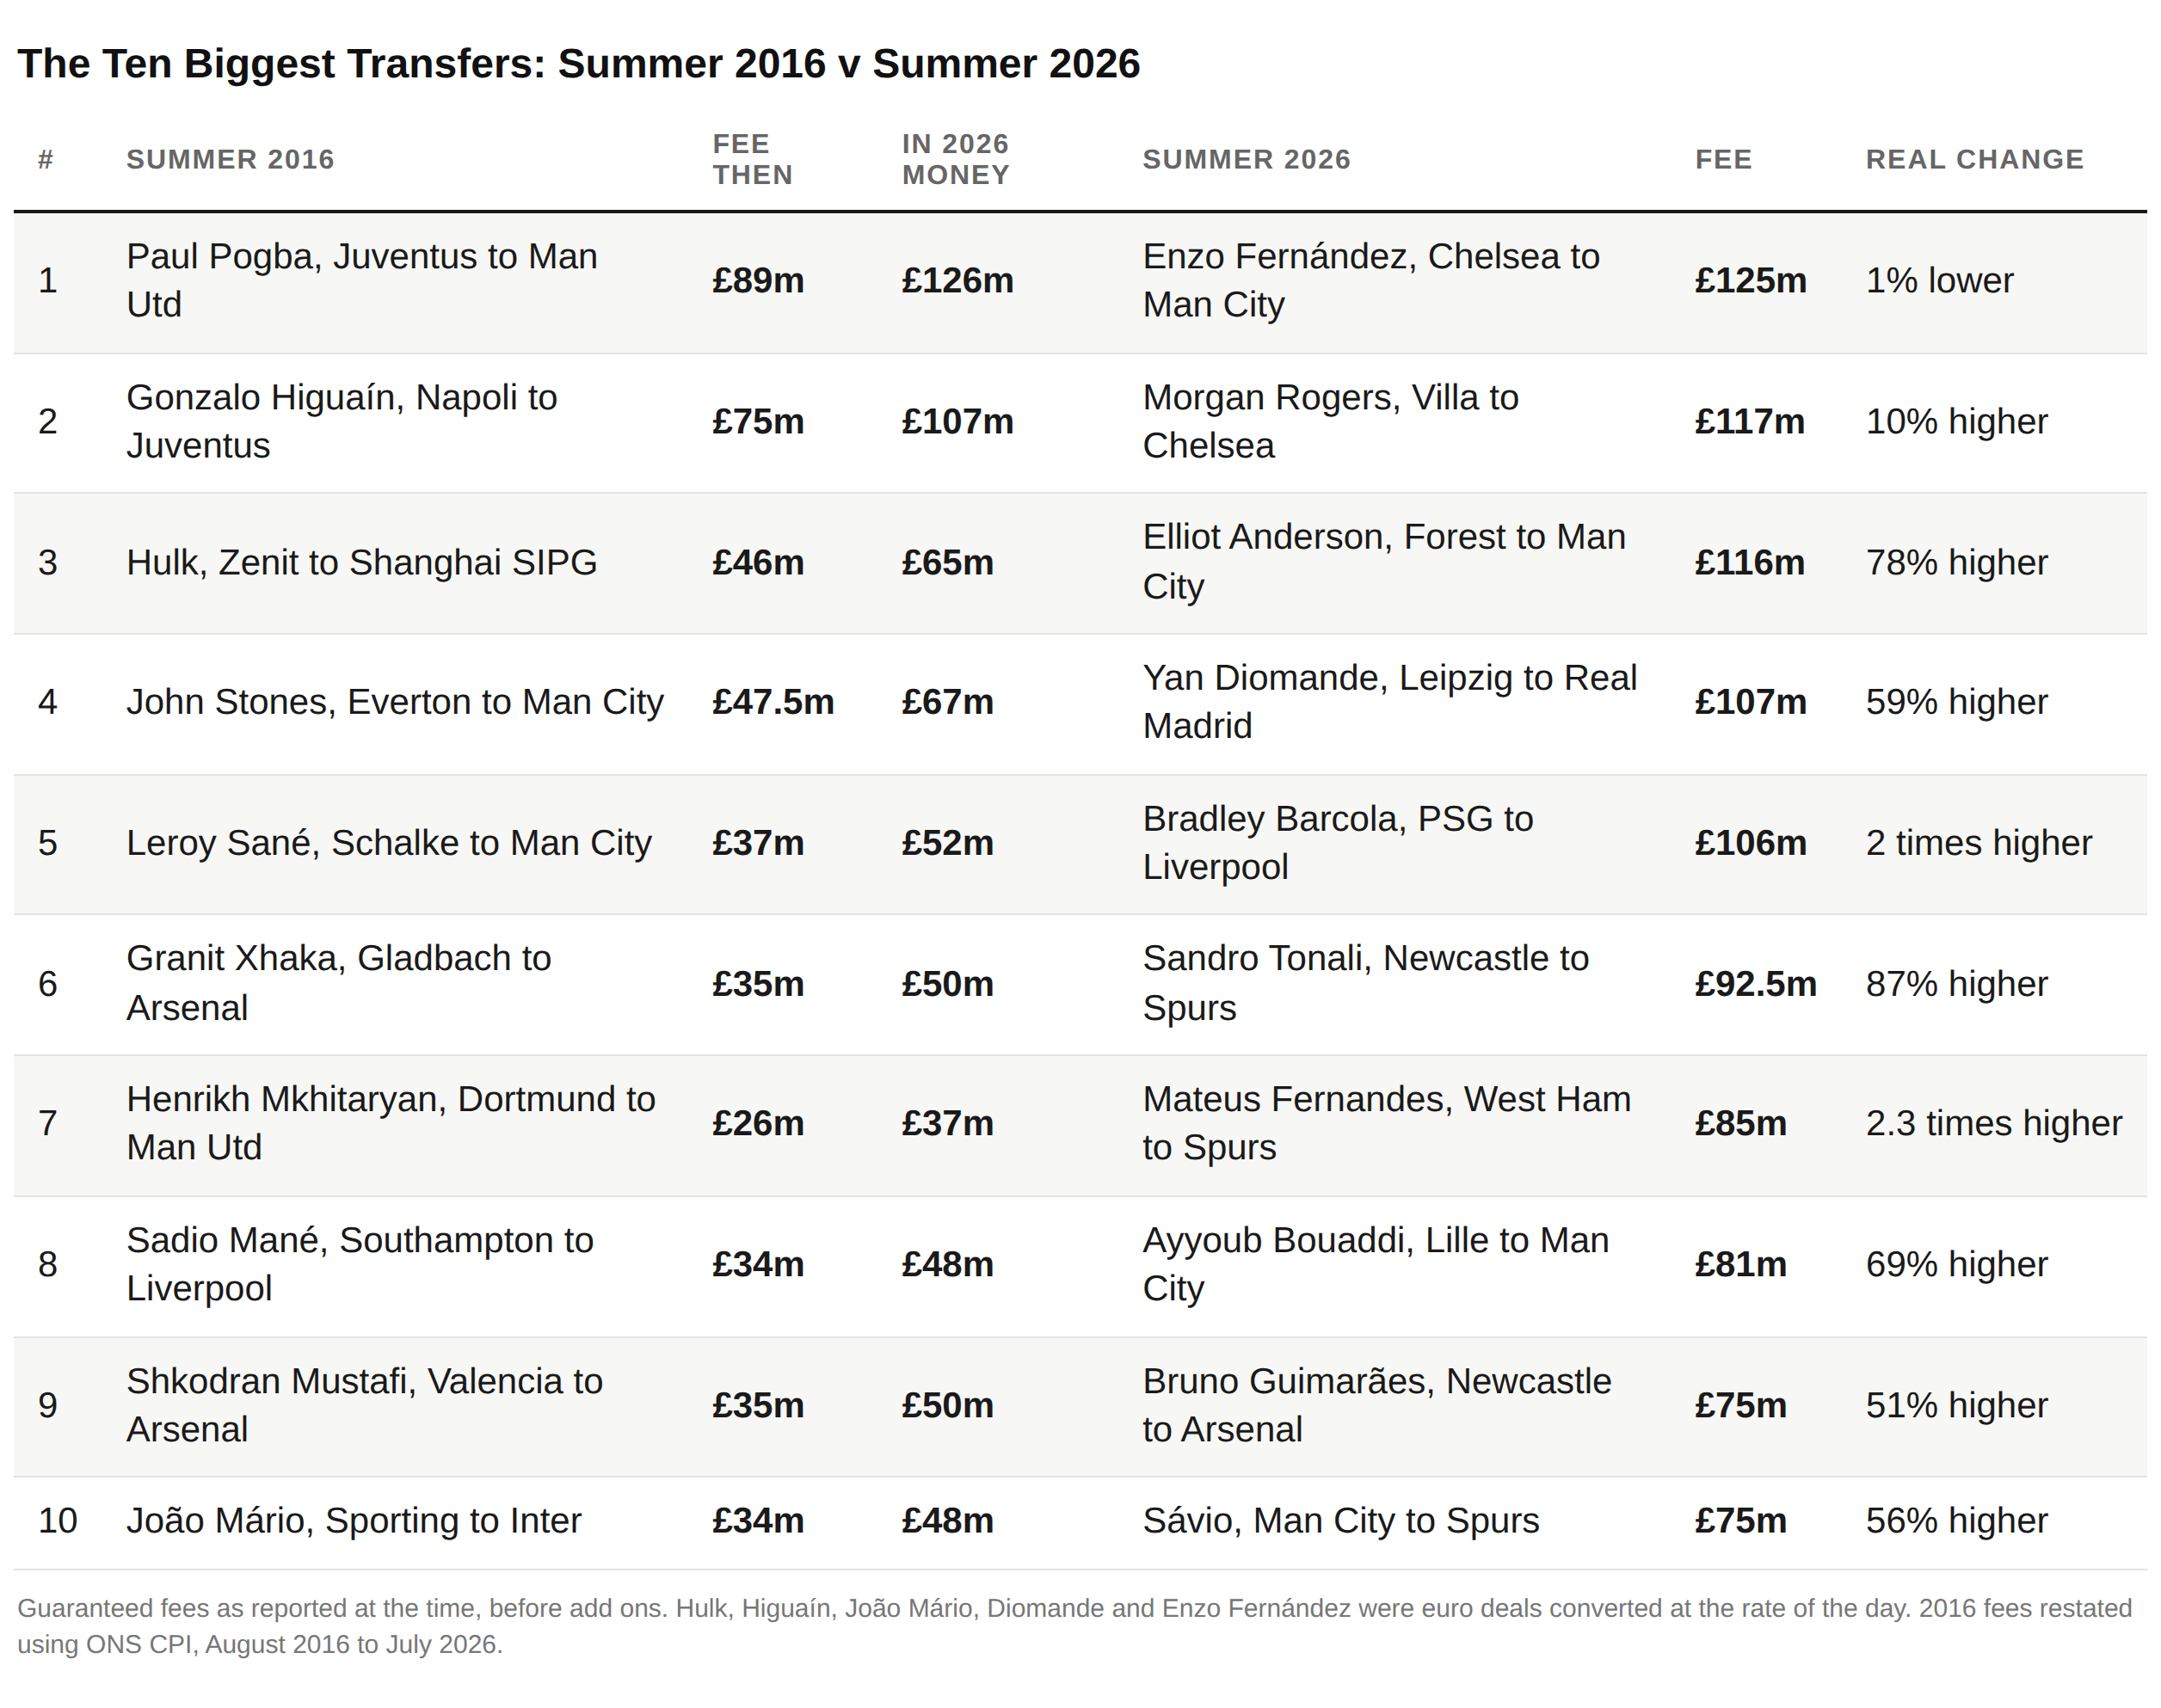
The table below shows the ten biggest transfers of each window, with each 2016 fee restated in 2026 money. The 2016 top ten cost £459 million, which is £650 million in today’s money. The 2026 top ten cost £980 million. Comparing £459 million with £980 million, spending has more than doubled, up 113%. Strip out the rise in prices, and the real increase is 51%.
Whilst the record fee at the top has not moved in real terms, the money spent on the next nine has. The tenth largest deal of 2016 would cost £48 million today; a fee that ranked tenth in the world in 2016 would not make the top twenty in 2026, in a window where 21 deals cleared £51 million. The Pogba and Higuaín transfers would have crossed £100 million in today’s money, and then there is a £42 million drop-off to Hulk. In 2026 there were five deals over £100 million, and the rest were all higher than the Hulk fee. A £100 million player this summer costs no more, in real terms, than Pogba cost in 2016. There are more of them: two deals reached that level a decade ago, five this window.
Three other points of interest. In 2016, buyers were spread across England, Italy and China; in 2026, nine of the ten buyers were Premier League clubs, and seven of the ten sellers were too. The 2016 list contains a centre forward and two centre backs; the 2026 list contains neither. Interestingly, seven of the ten are central midfielders, and the average age fell from 24 to under 23.
Position For Position
To help you compare players, we created the table below, which pairs the two windows by position: what a club paid for the position in 2016, restated in today’s money, against what a club paid for it in 2026. You can decide whether Enzo Fernández is a better, worse, or similar player to Paul Pogba, or how Bradley Barcola compares to Sadio Mané. Liverpool have spent 2.2 times more in real terms; will they get twice the player?

Comparing the central midfielders.
The best comparison is Paul Pogba and Enzo Fernández. Both are the record signings of their respective summers at near-identical real prices, both box-to-box midfielders, and both world champions. Pogba gave United six seasons, 226 games, 39 goals, a Europa League and a League Cup, then left on a free transfer; Fernández, 25, arrives with UEFA Conference League and Club World Cup medals and rejoins Enzo Maresca. Beneath them, the comparison widens rather than pairs, because 2016’s list carried three central midfielders and 2026’s carries six. Granit Xhaka’s £50 million in today’s money bought Arsenal 297 games and two FA Cups; Elliot Anderson, the same age at signing, cost City 2.3 times that. João Mário, a European champion at £48 million restated, gave Inter one season as a regular; Mateus Fernandes, at £85 million, is 21 and twice relegated. And Sandro Tonali at £92.5 million and Bruno Guimarães at £75 million have no 2016 equivalent at all: a decade ago, nobody paid top-ten money for a third and fourth central midfielder.
The wide forwards.
Sadio Mané cost Liverpool £48 million in today’s money and delivered 269 games, 120 goals, the Champions League and the club’s first title in 30 years. Bradley Barcola arrives in the same role at £106 million, rising to £123 million, with two Champions League wins and 39 PSG goals at 23. And Manchester City’s winger trade frames the decade from both ends: Leroy Sané bought at 20 for £52 million restated and sold at a profit; Sávio sold this summer at £75 million after seven goals in 84 games.
The No.10.
The widest gap in the table. Henrikh Mkhitaryan cost £37 million in today’s money at 27, scored the goal that won United the Europa League, and was traded away after 18 months. Morgan Rogers, 23, cost £117 million on a seven-year contract: an England World Cup regular who scored on his league debut.
Other positions.
The 2016 window put top-ten money into a striker and two centre-backs; the 2026 window bought neither. Gonzalo Higuaín’s £107 million restated bought Juventus 66 goals and three titles, and the nearest modern comparison is Liverpool’s £125 million for Alexander Isak a year earlier, the fee Fernández has just equalled. The defenders tell the sharper story. John Stones cost £67 million in today's money in 2016; the defender record then peaked with Harry Maguire's £80 million in 2019, about £106 million restated, and it has never been approached since; the most expensive defender of the 2026 window, Rennes centre-back Jérémy Jacquet, cost £55 million. Over the decade, the market moved its money out of defenders and into midfielders, and the price of the best defender has halved in real terms from its peak.
How The Clubs Can Afford It
The Premier League’s central broadcast income is about £3.84 billion a season, against £2.8 billion in 2016/17. That is £1 billion a season more in cash, a rise of about 40%, which is level in real terms once the decade’s price rises are counted. But cash is what pays transfer instalments and wages, and whatever else has changed, the clubs have never had more coming in.
How they now get it is interesting. The UK television market that secured the 2016 deal no longer exists. Sky and BT were then bidding each other up for a scarce product; a decade of streaming platforms competing for the same audience ended that. The latest domestic deal, running to 2029, pays £6.7 billion over four years for at least 267 live matches a season, against £5.14 billion over three years for 168 matches in the 2016 cycle. The clubs surrendered a hundred more games a season to hold the headline number up, and the value of each televised match fell from £10.2 million to £6.3 million. Domestic income per season is now slightly below its 2016 peak in cash terms.
The growth came from abroad. Overseas rights were worth around £1 billion a season in 2016 and £2.2 billion now, and they overtook domestic income for the first time in the 2022 cycle. The headline totals are also flattered by length. While the domestic deal renews every three or four years, the biggest overseas contracts run longer, led by NBC’s six-year, $2.7 billion agreement in the United States, with broadcasters paying a premium for the certainty of a locked-in product.
The Premier League clubs are getting more money in, but they are giving more away: more matches, and longer contracts. For the clubs, the priorities are annual revenue and income certainty. A six-year deal locks in what the club will earn for six years, and that certainty is what lets a club spread a £117 million fee over a contract to 2033, or borrow against seasons that have not been played yet. Against those two requirements, a fall in the price of any single match is secondary. Don’t be surprised if the next cycle is sold on five- and ten-year terms.
The League That Pays Itself
Surprisingly, the clubs are not hitting matchgoing fans with the bill. Some discounts have gone, Manchester United scrapping child and pensioner concessions for a flat £66 matchday price among them, but by and large ticket prices rose well below the 42% rise in prices over the decade, and the £30 away cap set in 2016 is still £30 in 2026, a cut of a third in real terms. Even TV subscriptions have risen only 10 to 20%, so leaving aside travel and the price of a pie, fans are not being hit too hard in the pocket.
What has changed is who the clubs sell to. Premier League clubs spent a record £3.46 billion this window, and around 38% of the deals were between them, up from 30% a year earlier. Last season’s trading between Premier League clubs reached £1.29 billion, the highest since 2016. Seven of the ten biggest sales this summer were made by Premier League clubs, and the buyers were their direct rivals: Chelsea sold Enzo Fernández to Manchester City; Newcastle sold Sandro Tonali and Bruno Guimarães to Tottenham and Arsenal for £167.5 million combined; Brighton sold Carlos Baleba to Manchester United.
A decade ago you did not sell your best player to a competitor; Arsenal selling Robin van Persie to United in 2012 caused uproar precisely because it broke that rule. Today the competitor is the only buyer with the means to pay the fee you want, and the spending rules reward the trade: a sale counts as profit immediately, while the purchase is spread over the length of the contract. Selling one player to a rival can fund a summer. Maybe this is how the clubs support their spending: the league has become its own biggest customer, recycling the television and owner money around itself, with each club’s record fee received becoming another club’s record fee paid.
One reading of all this says the spending is extravagance: clubs that lose money paying £980 million for ten players in a window, funded by owners covering losses year after year. The other says there is method in it: the fees have risen no faster than prices, the losses land on owners as equity rather than on clubs as debt, and the money increasingly circulates inside the league itself. Both readings fit the same numbers, and which one holds depends on whether the owners and their lenders keep writing the cheques. That is the difference between football and the four leagues in the next table, each a giant in its own market, two of them American.

The Same Ten Years In Four Other Sports
Football has no salary cap and no agreed share of revenue for players, so the top of its market is set by what one owner will fund. Most other big leagues work differently, and the same 2016 against 2026 comparison shows what a formula does to a star’s price. Each is adjusted by how far prices have risen in its own country: 42% in Britain, 63% in India, 36% in Australia and 39% in the United States.
The NFL and NBA pay players a fixed share of league revenue, close to half, and cap each team’s spending. When the television money rises, the cap rises, and the biggest contract, a set percentage of the cap, rises with it. American stars have nearly doubled their real pay since 2016 because their leagues nearly doubled their income, and the players are entitled to their half.
In India, the IPL kept the growth for its owners. Media rights have risen seven times in real terms, but the auction purse each franchise spends on players has risen by only 16%. Cameron Green’s record ₹25.2 crore, about £1.95 million, is 63% more than Shane Watson’s 2016 price, but the players as a group saw little of the rise, which is why an IPL franchise has become one of the most sought-after assets in sport.
The NRL is the surprise. The salary cap has risen 29% in real terms, while the broadcast deal is up 43%, yet Nathan Cleary earns less in real terms than Johnathan Thurston did in 2016. The extra money went on broadening the squad, with a higher minimum wage, and the cap now covers 30 players instead of 25, with an unofficial ceiling for the stars held at A$1.3 million.
All of these leagues have spending controls: the American leagues and the IPL tie player money to league revenue, the NRL to a cap. In every one of them, the best player's price in 2036 can be estimated from the next TV deal.
In football, it depends on who owns the clubs by then, and what they are still willing to fund. Over the decade, the league's income held level in real terms while spending at the top rose 51%, and it is arguable whether player quality rose with it. On the trend in these tables, the next decade brings the Premier League's first £200 million fee, with ten or fifteen players costing over £100 million. The clubs are not blind to the risk; the new squad cost rules, longer contracts, and trading between themselves are all ways of managing it. But a market this size resting on owner funding has the shape of a bubble, and bubbles burst. Either the top of the market gets tied to income, as it is everywhere else, or it stays tied to owner largesse. One of those is a business. The other is a bet.